

| Years | Overall Accuracy (%) | Kappa Coefficient | Producers Accuracy (%) | Users Accuracy (%) |
| 2000 | 93.52% | 0.90 | 71.26% | 82.65% |
| 2003 | 95.55% | 0.93 | 88.70% | 90.02% |
| 2006 | 94.82% | 0.93 | 72.89% | 87.34% |
| 2010 | 96.38% | 0.94 | 79.85% | 91.57% |
| 2013 | 92.85% | 0.88 | 83.37% | 88.39% |
| 2015 | 94.02% | 0.91 | 93.69% | 95.29% |
| 2019 | 94.07% | 0.91 | 88.02% | 92.47% |
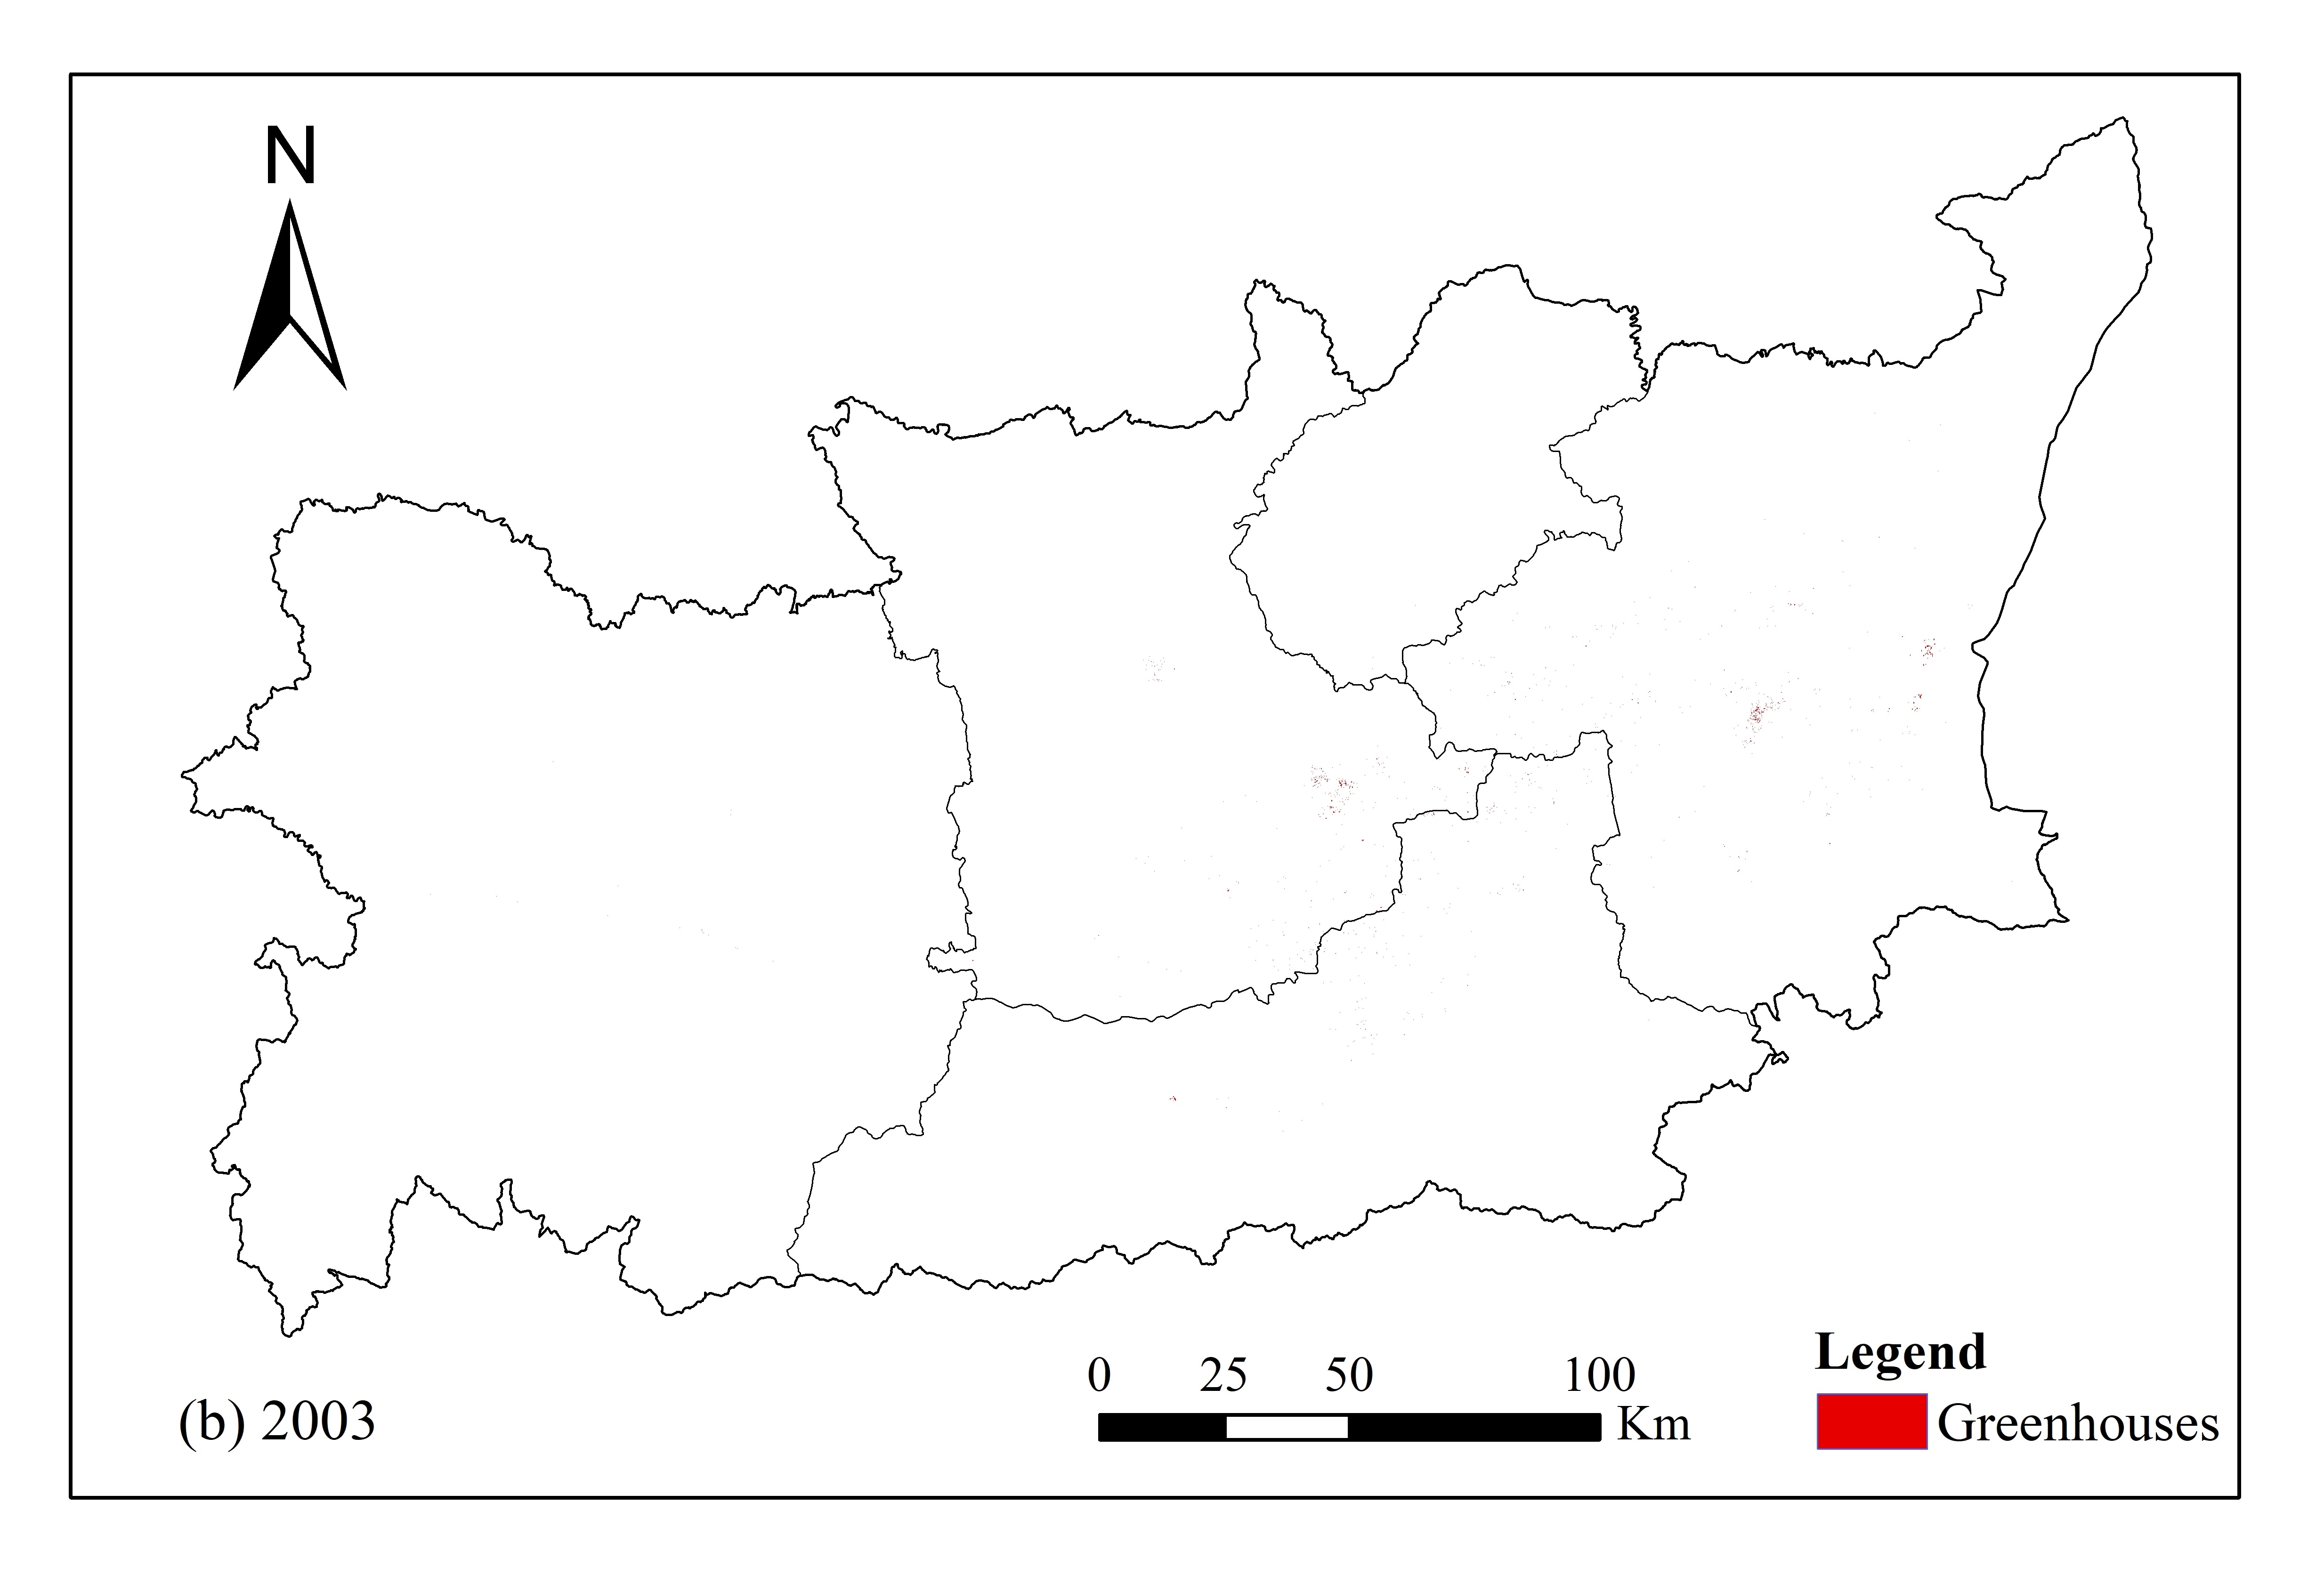
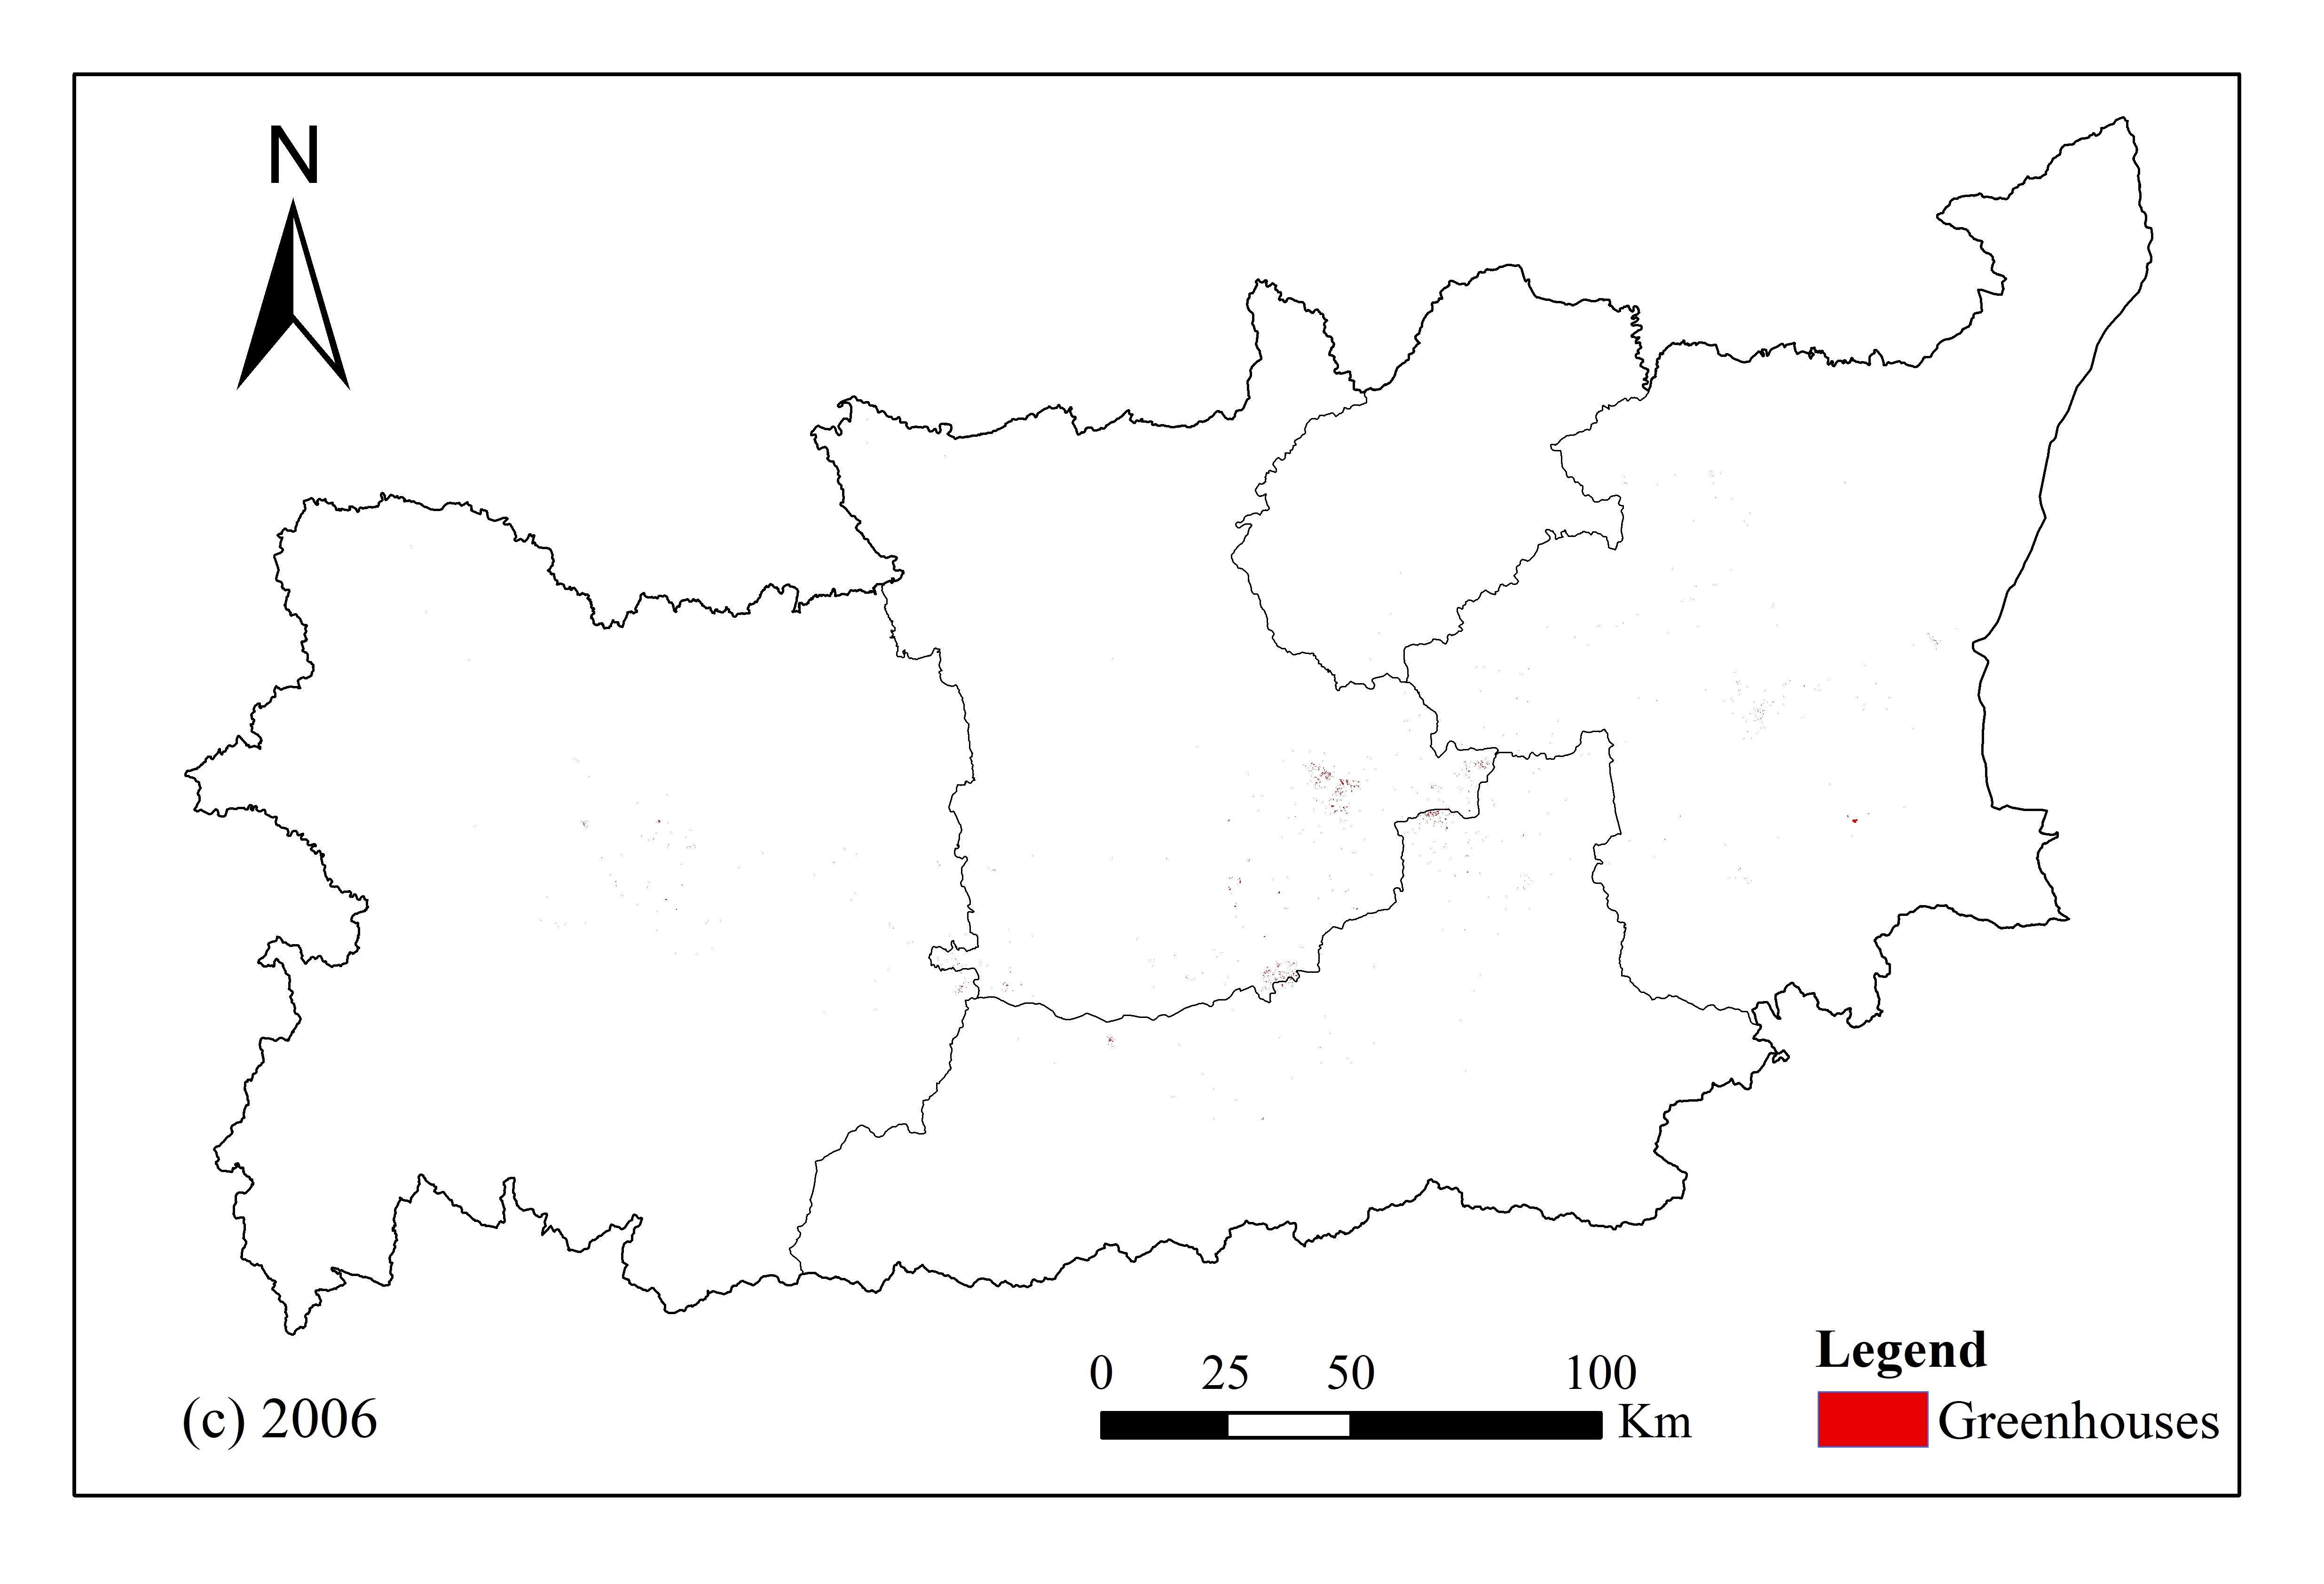
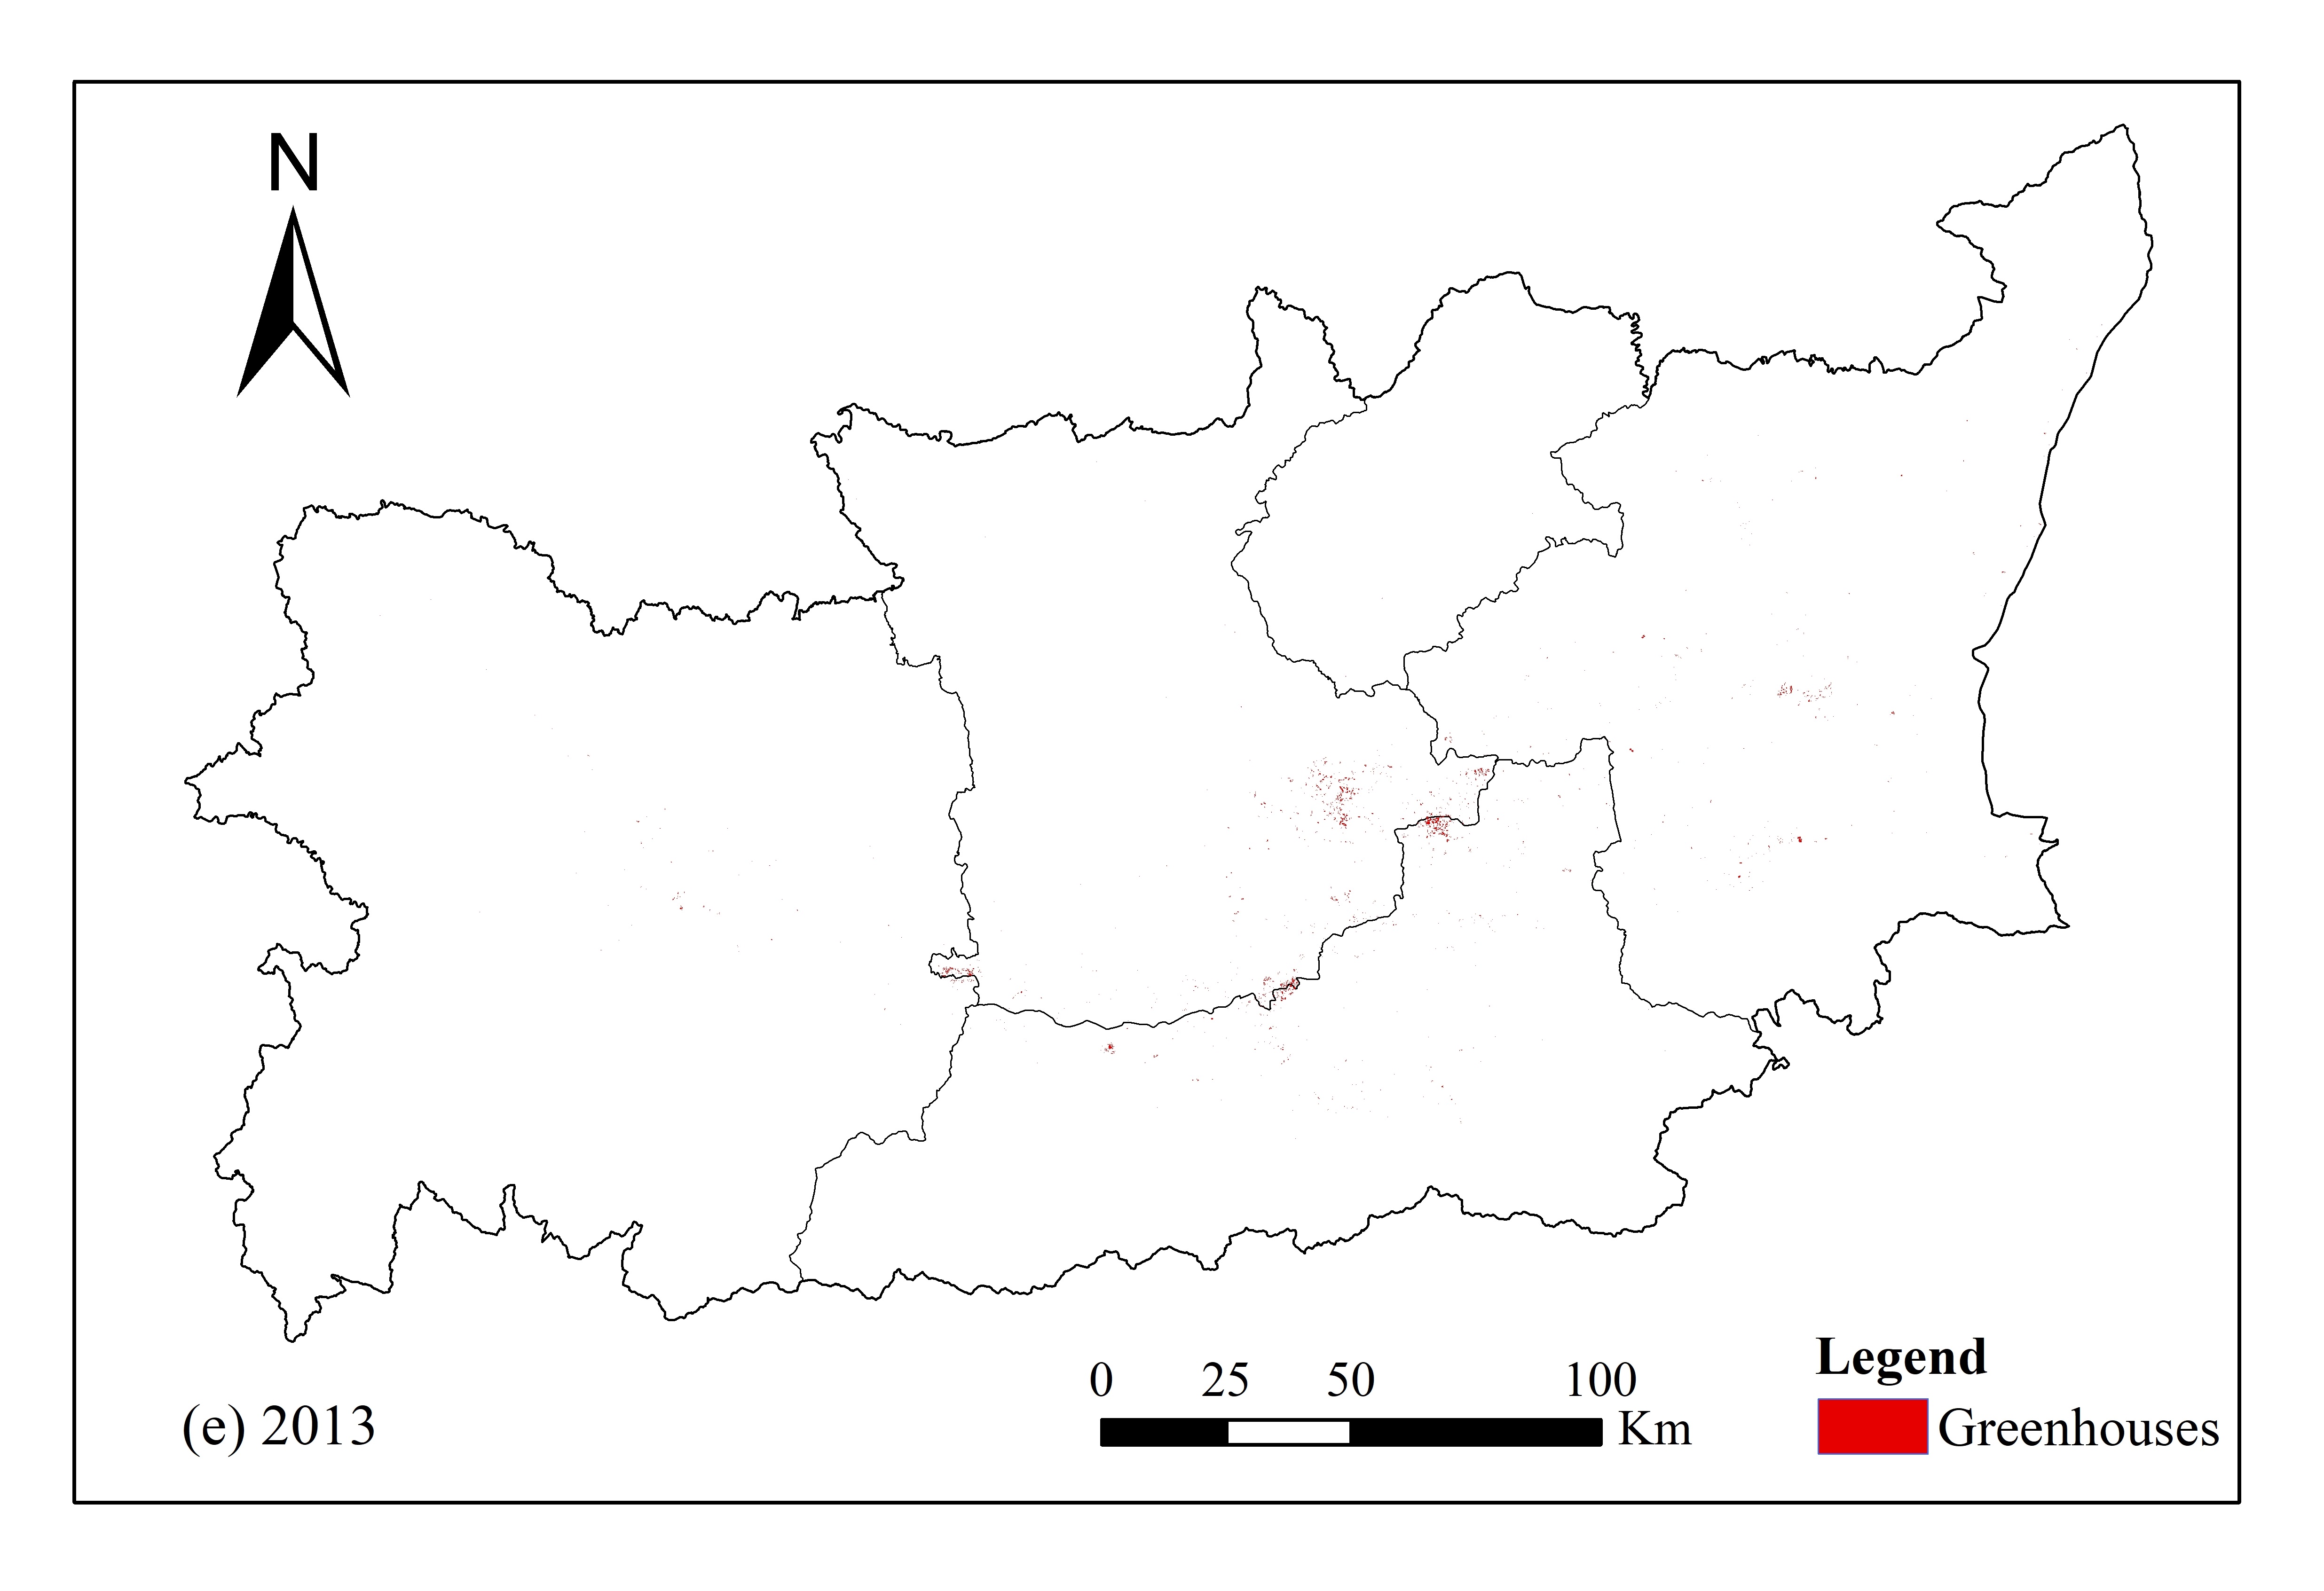
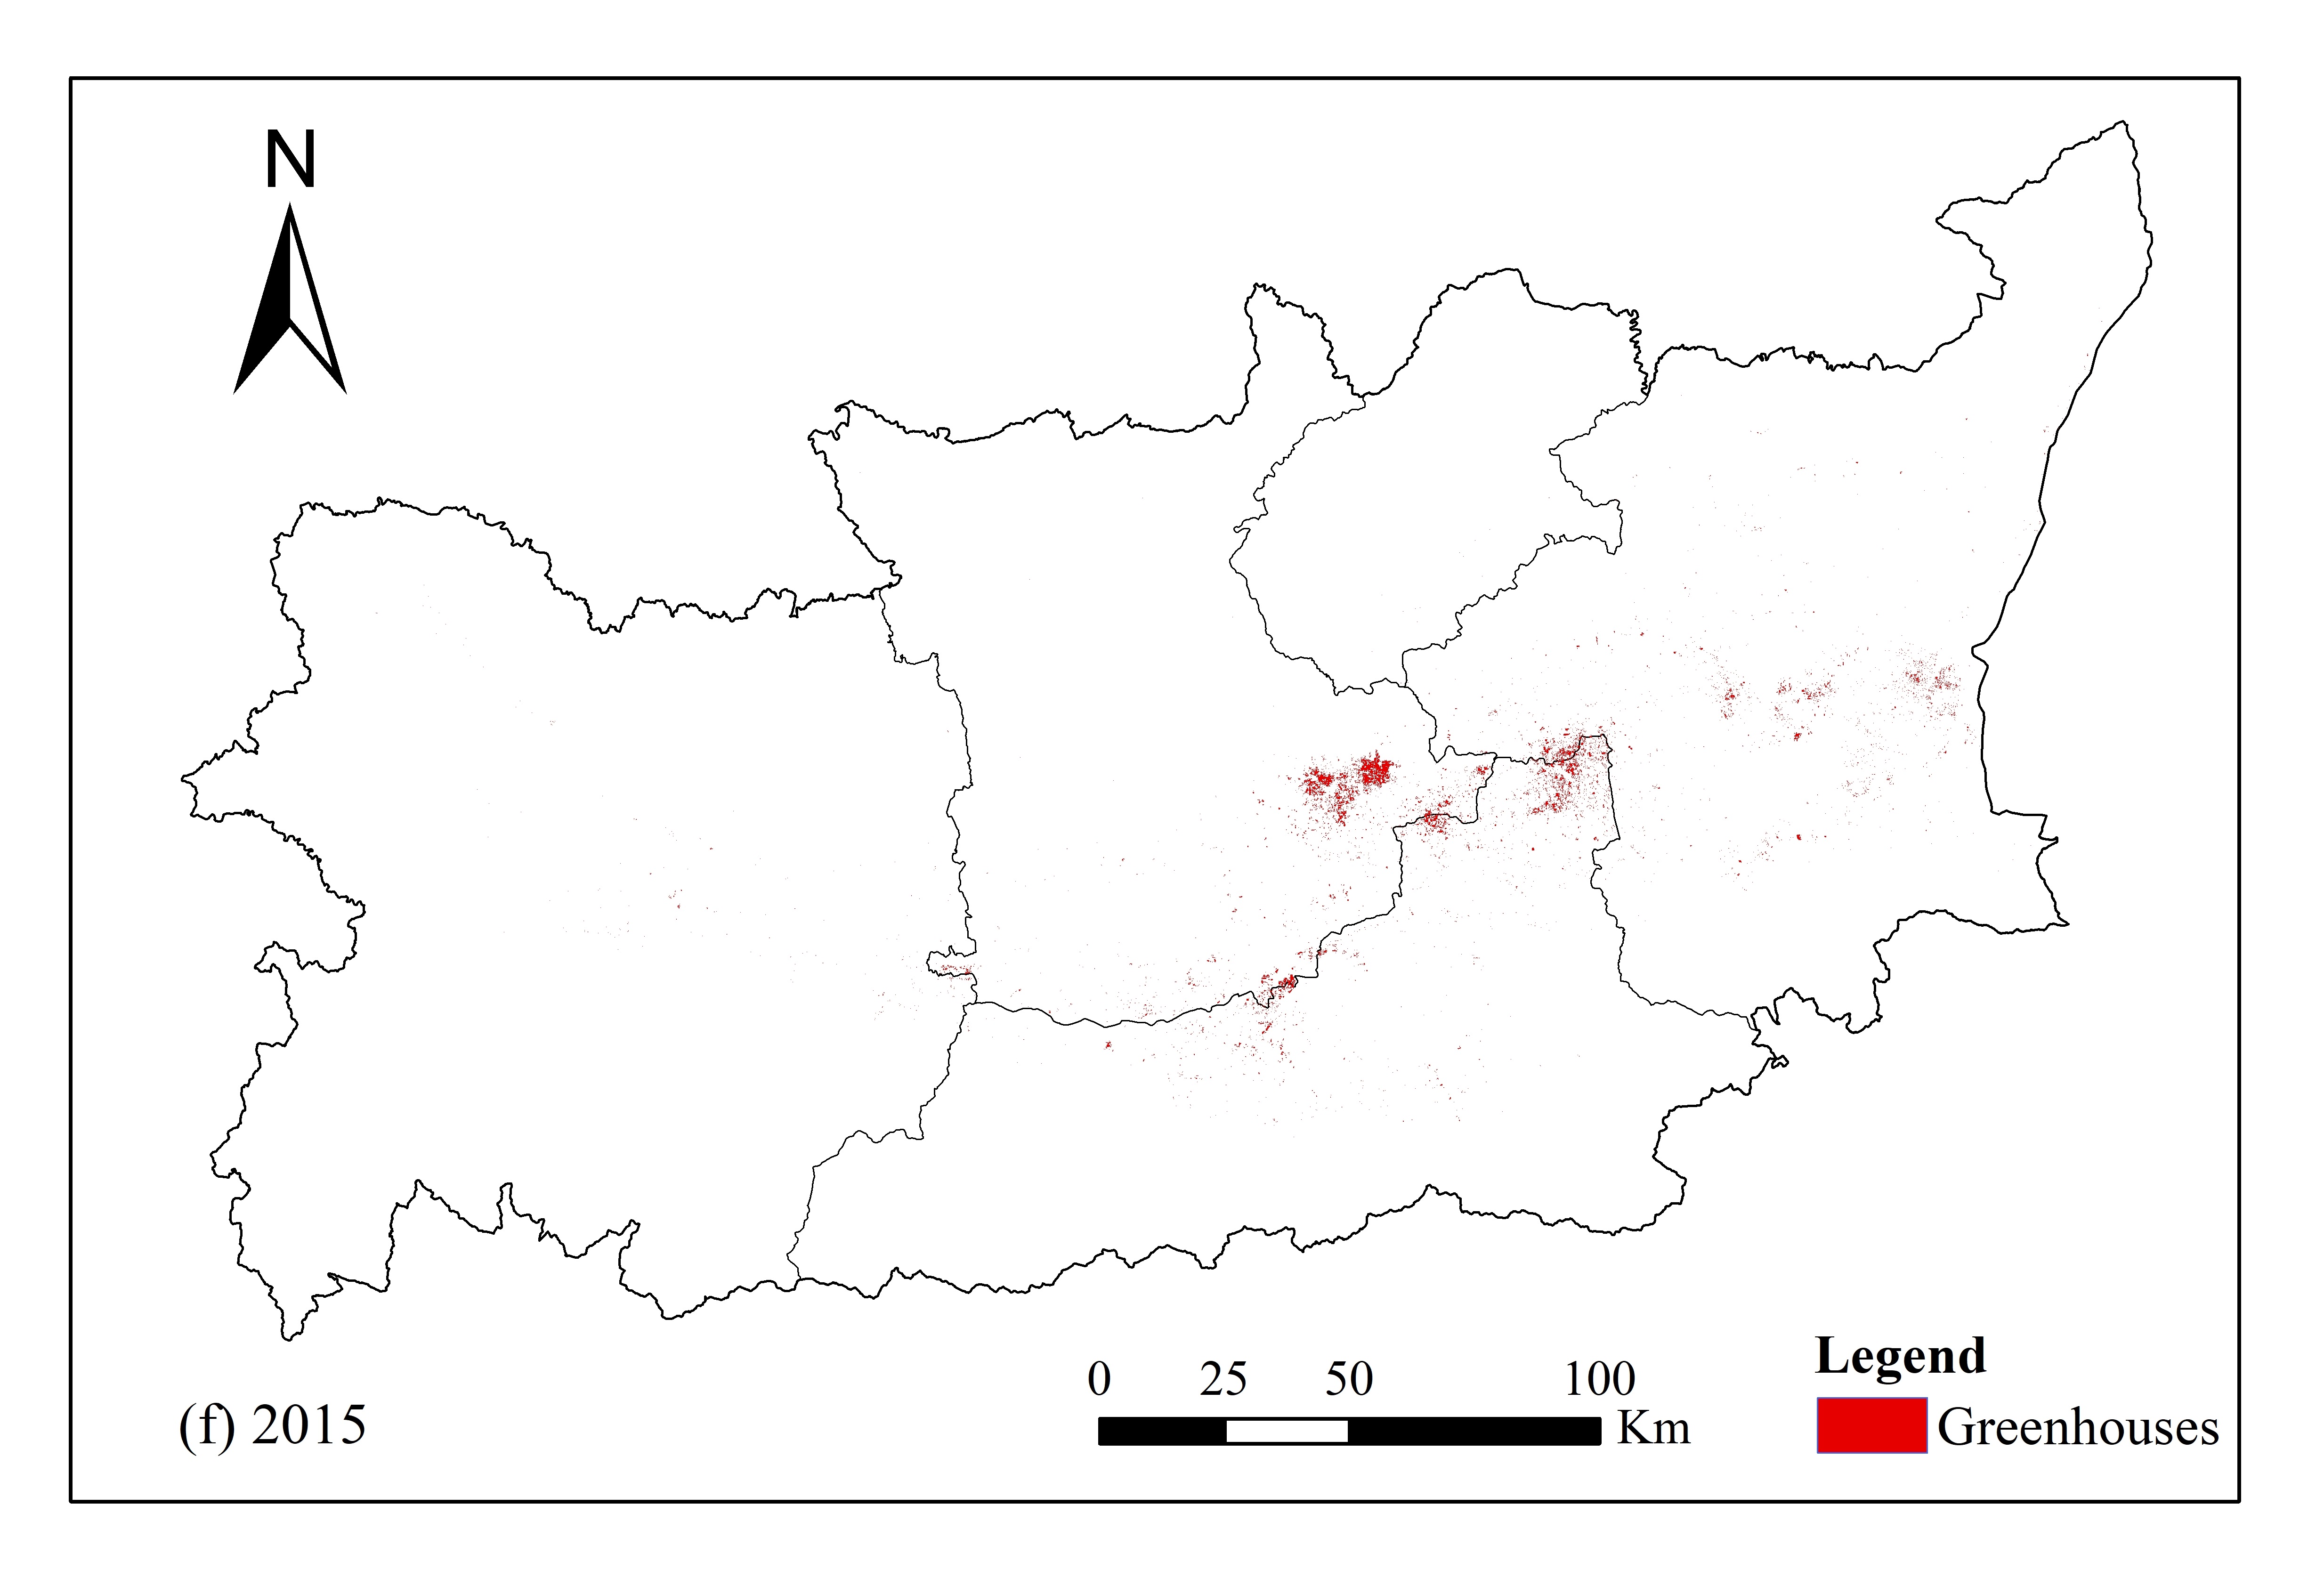
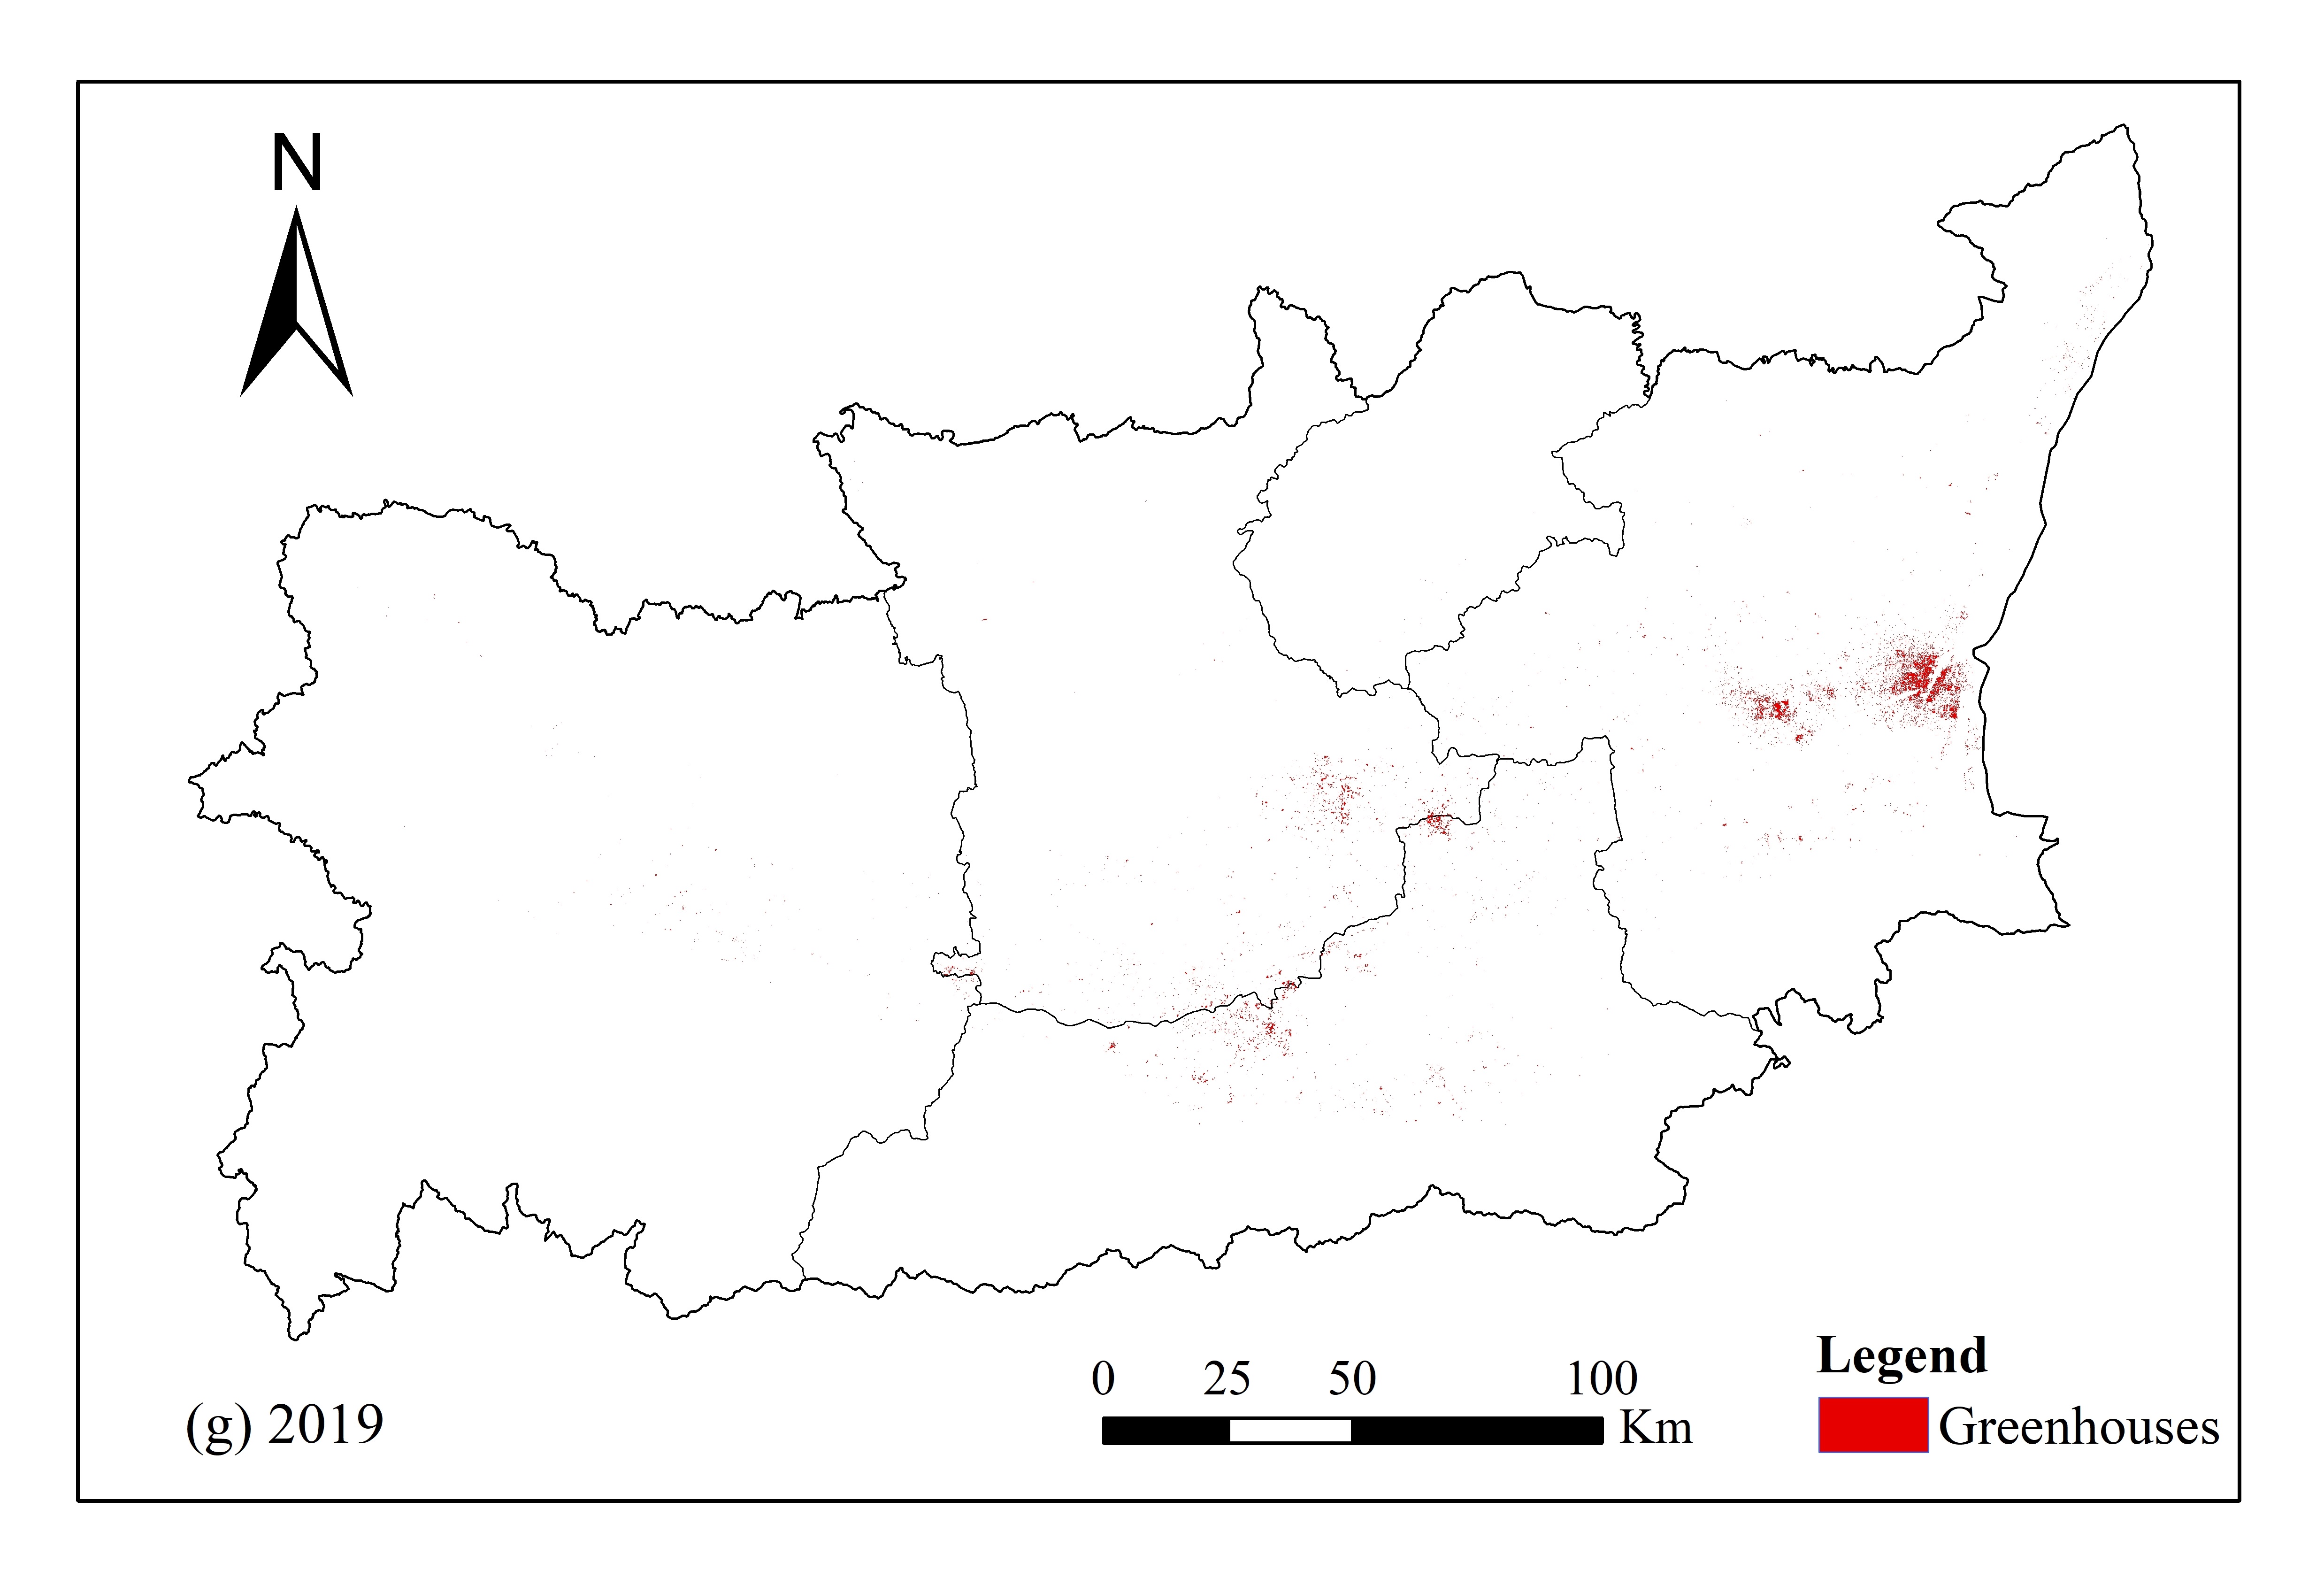
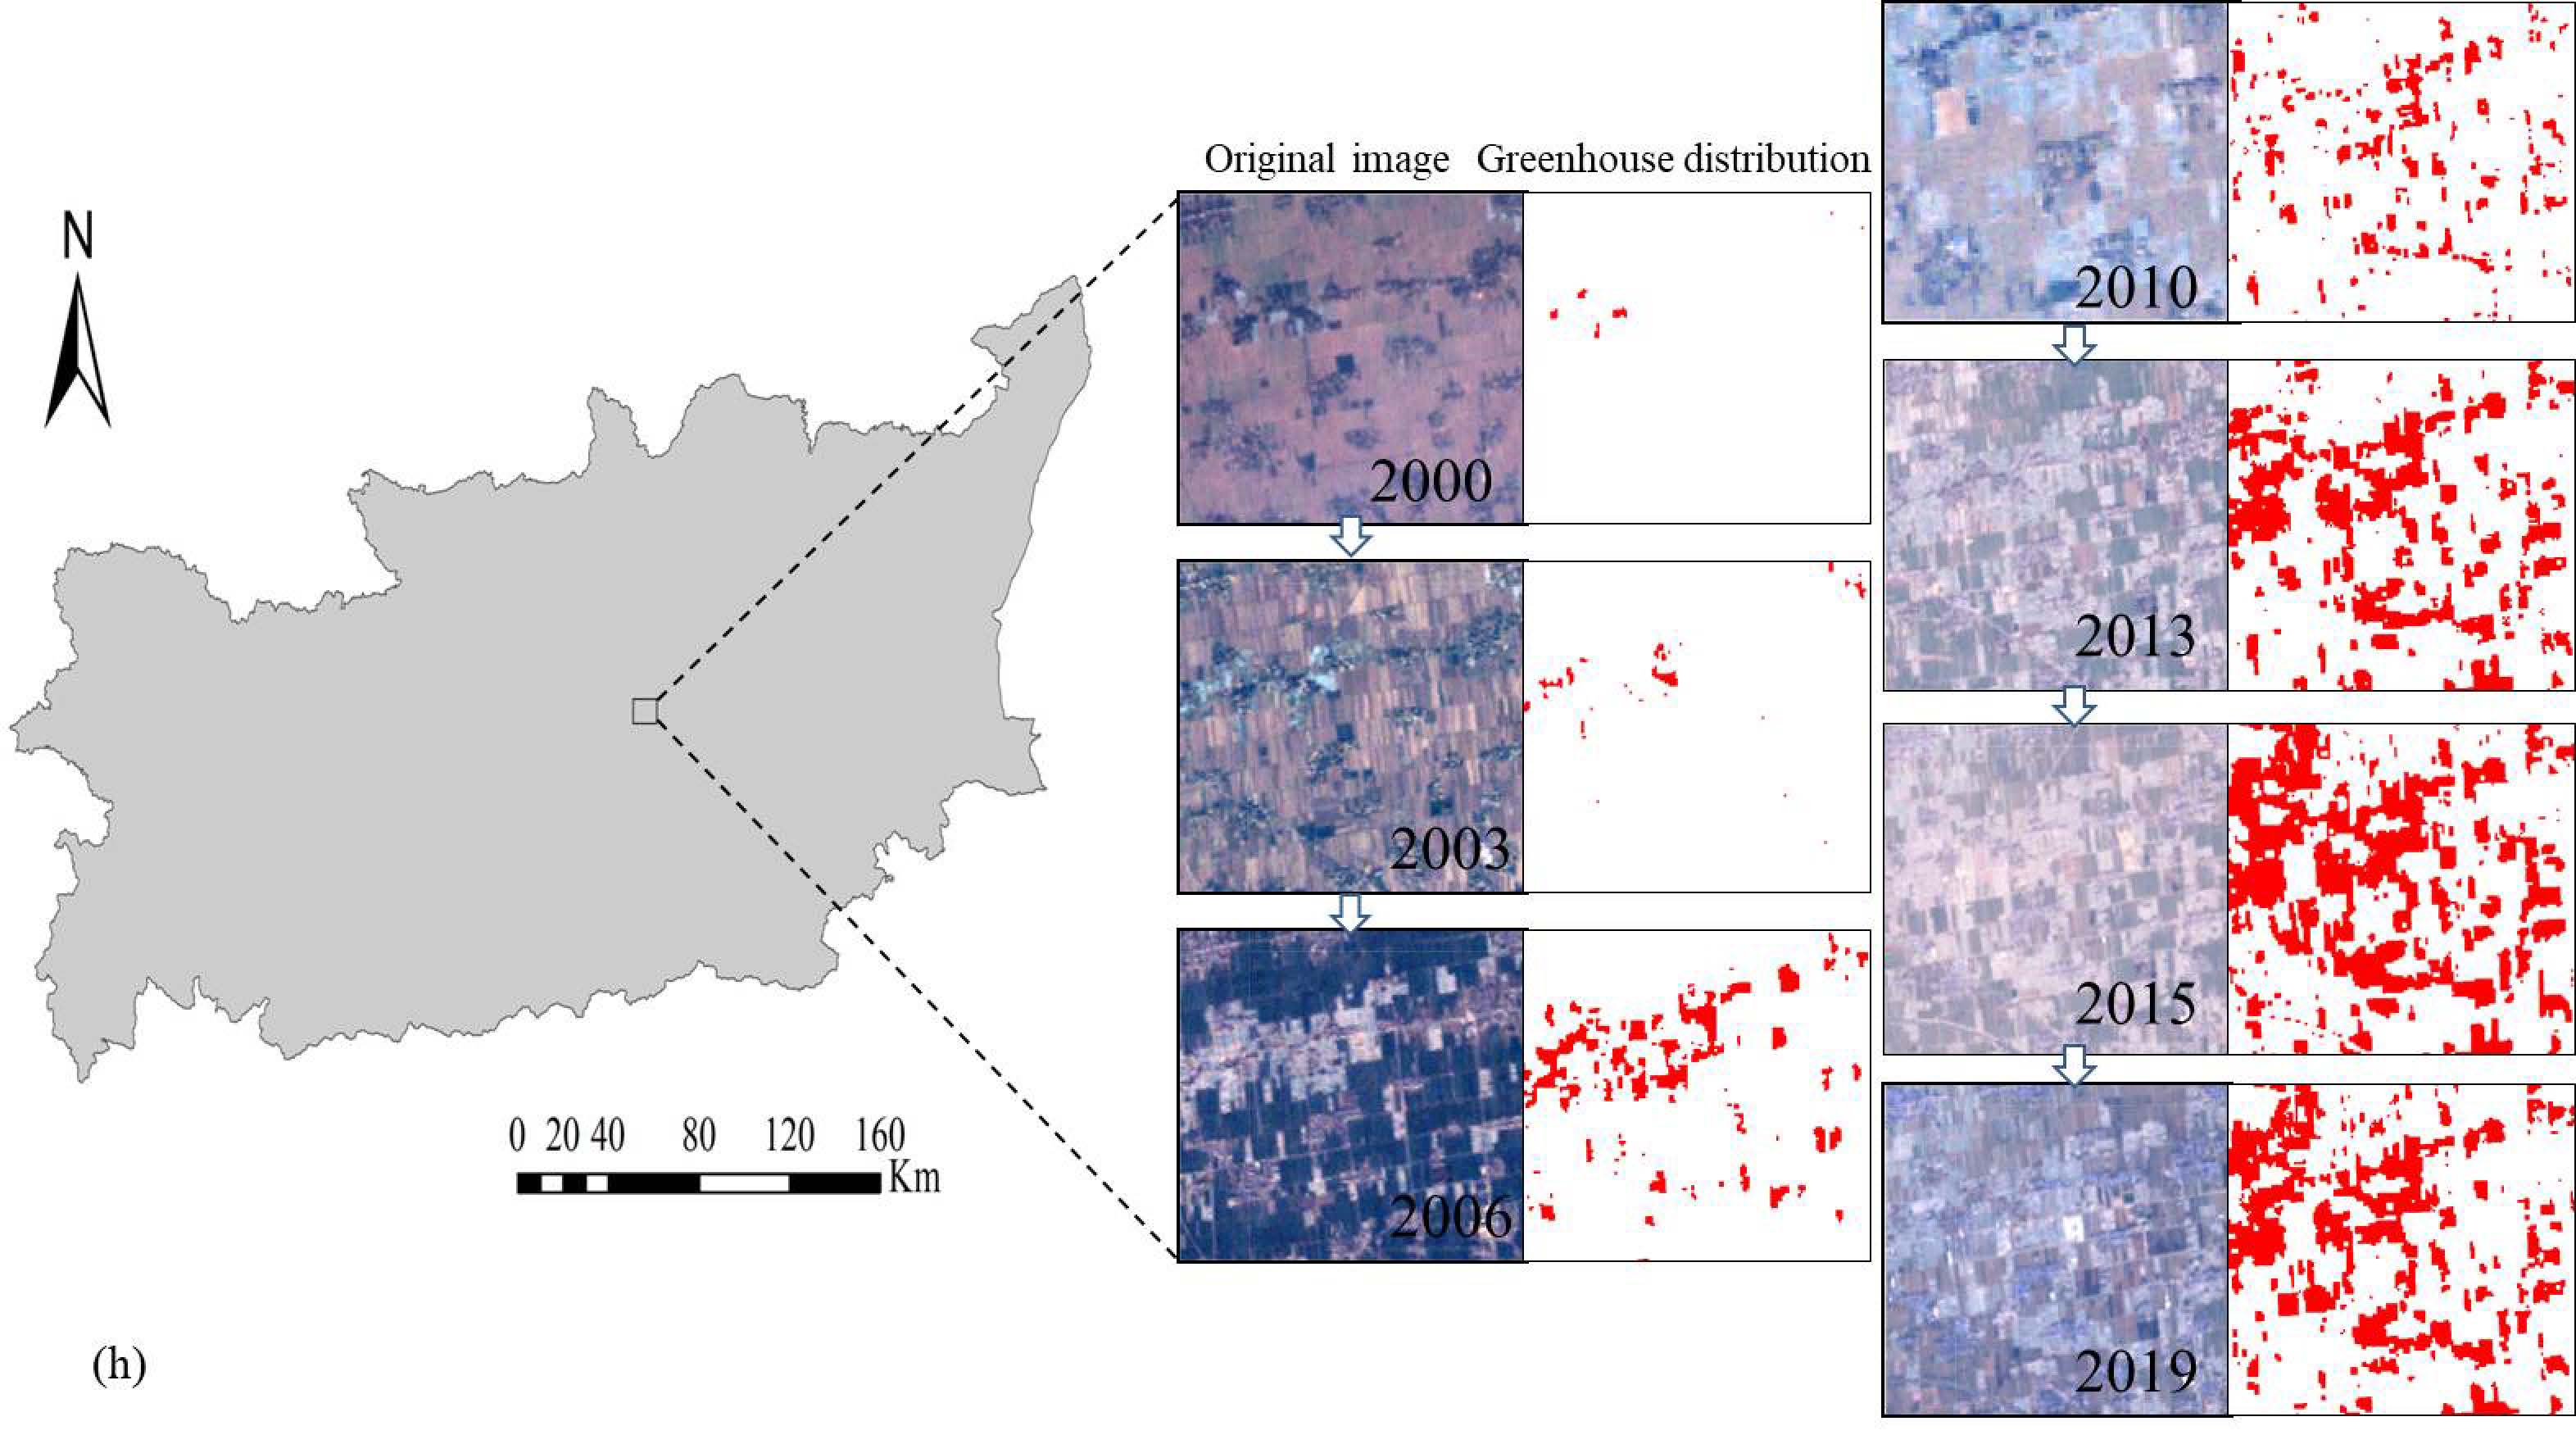
Figure a-g show the distribution of greenhouses in Guanzhong Plain in seven years (2000, 2003,
2006, 2010, 2013, 2015, 2019), respectively. Figure h represents the spatio-temporal distribution
change of greenhouses in a selected area. The classification results (Figure a-g) are corresponded
to four evaluation indicator of each year in Table 4. The overall accuracy of each year and the
kappa coefficient is euqal to or greater than 90%, which is expected to meet the requirements for
quantifying greenhouses’ dynamics distribution.
| / | 2000 | 2003 | 2006 | 2010 | 2013 | 2015 | 2019 |
| F1-score | 0.44 | 0.89 | 0.795 | 0.854 | 0.858 | 0.945 | 0.902 |
F1-score (Table 5) was calculated for each year based on two classes (greenhouses and non-greenhouses).
The values of F1-score are high in six years (2003, 2006, 2010, 2013 2015, 2019), which indicates that
a good quality of mapping results. The F1-score is low in 2000, depicting a low quality of the mapping
results.